Ermes Web App: powerful yet easy to use. Fresh and innovative. Attention to every detail
The web platform is the heart of the system.

ERMES WEB APP
The web platform is the heart of the system. It continuously receives data from the ErmesLog dataloggers installed on the plants or arriving via our API. The platform centralizes, stores and processes this information in a powerful cloud-based infrastructure that remains easily accessible via web browser or smartphone and tablet or via our apps published on the Apple store and Google play.
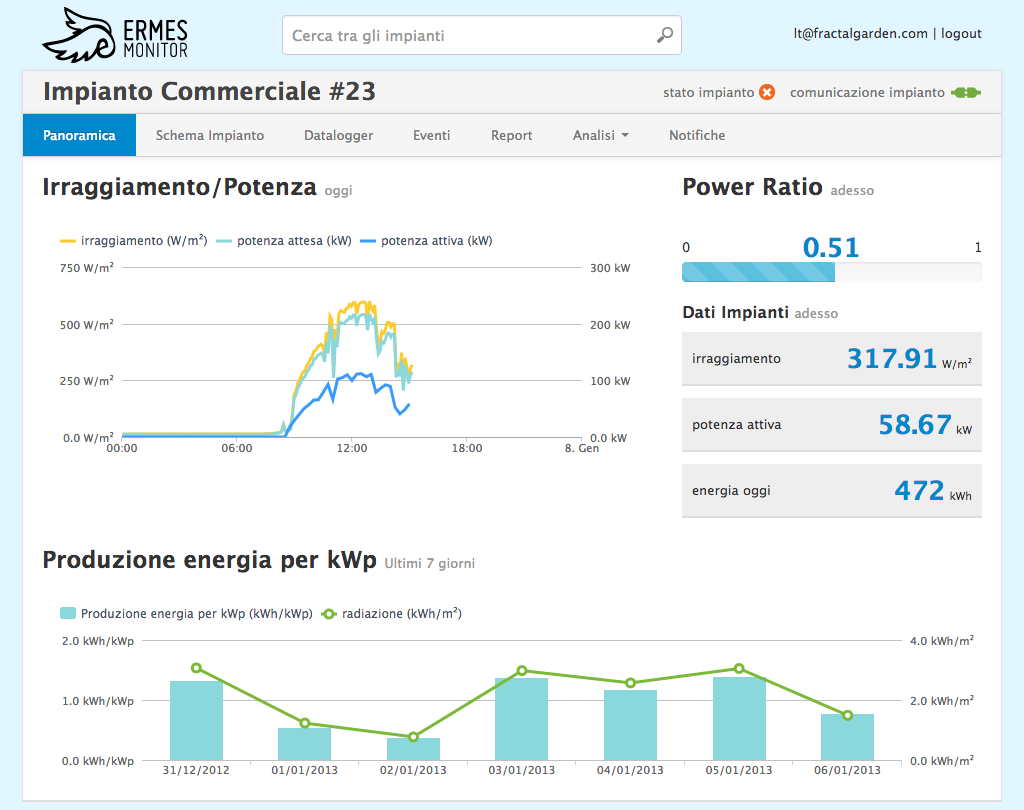
The platform is ideal for monitoring consumption and production. The more measuring instruments are installed at each site, the higher the degree of detail with which it is possible to carry out analyzes and become aware of one’s consumption and production profile.
Monitoring is mandatory in a structured energy efficiency path aimed at obtaining white certificates and 50001 certification.
The software is particularly versatile and allows with the same simplicity the monitoring of small domestic production plants (smart home) and the monitoring of the aggregate consumption of groups of industrial buildings distributed throughout the territory (aggregate dashboard).
Features
Smart Home 3D
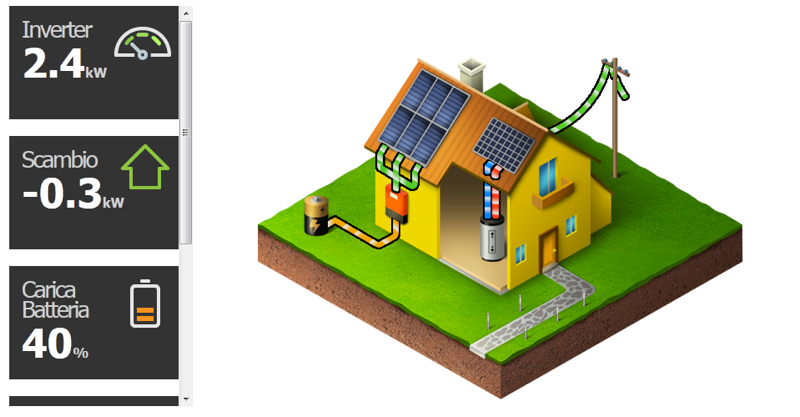
This is the simplified representation for domestic environments where there are photovoltaic, heat pumps, solar thermal, storage with lithium batteries and monitoring of electricity consumption at the general meter and up to the single appliance.
White label interface
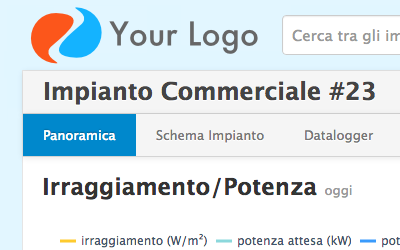
Propose your remote control system to your customers using your company logo and colors.
You can customize the interface to make your customer loyal only to you.
Independent & multi brand PV monitoring
The platform allows you to make the monitoring of even very heterogeneous systems uniform (useful when you have systems built with products of different brands or even when the system itself is composed of heterogeneous instruments that would require several different monitoring systems).
The datalogger in the field deals with interfacing with all brands of inverters, string panels, production and exchange meters, weather stations and more. Everything is made uniform and comparable.
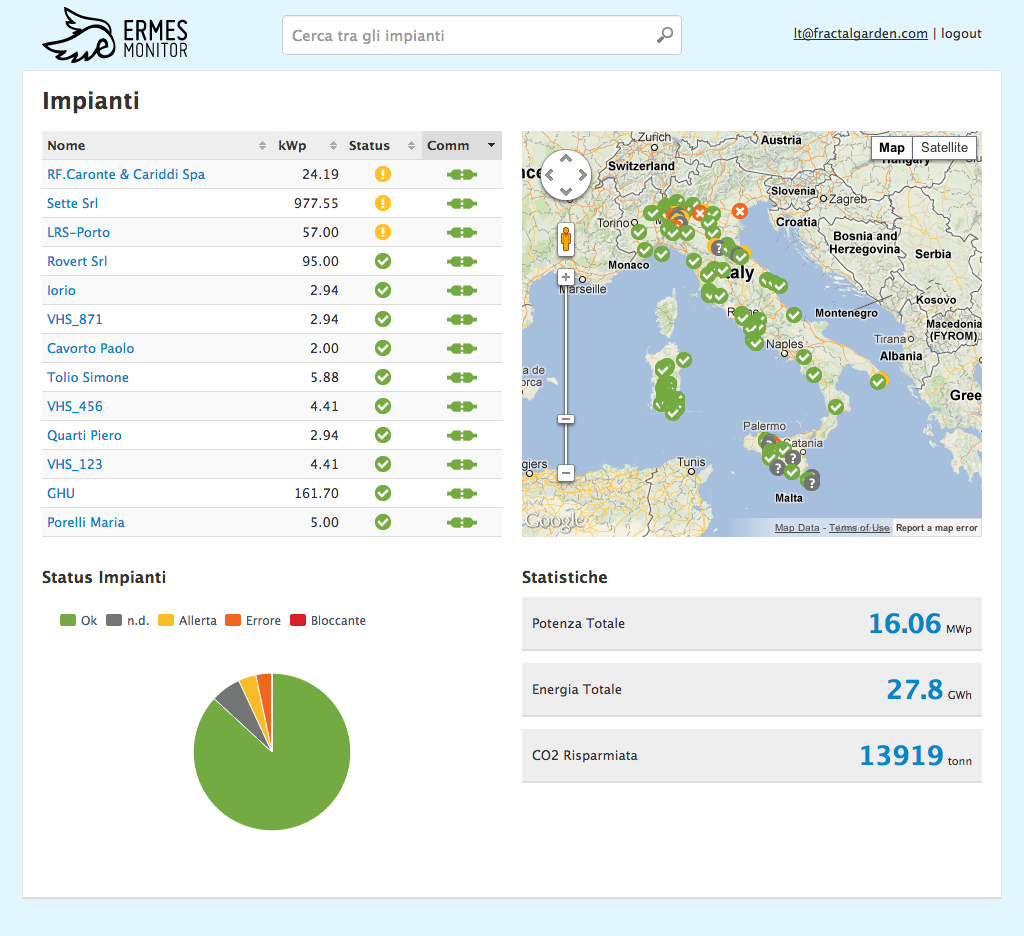
The platform allows you to easily obtain an overview of the consumption and aggregate production of your real estate and / or production portfolio.
The data is updated every 5 minutes and therefore you always have an updated and clear picture of the overall situation.
Obviously, in addition to an aggregate view, it is possible to open a single site to deepen its functioning in detail and view or download the entire history.
Easy and intuitive
The user interface has been designed to display information clearly and immediately.
There are various types of access that allow you to see more or less information.
Some users need to interact with the system others eg. to view only part of the information in read-only mode.
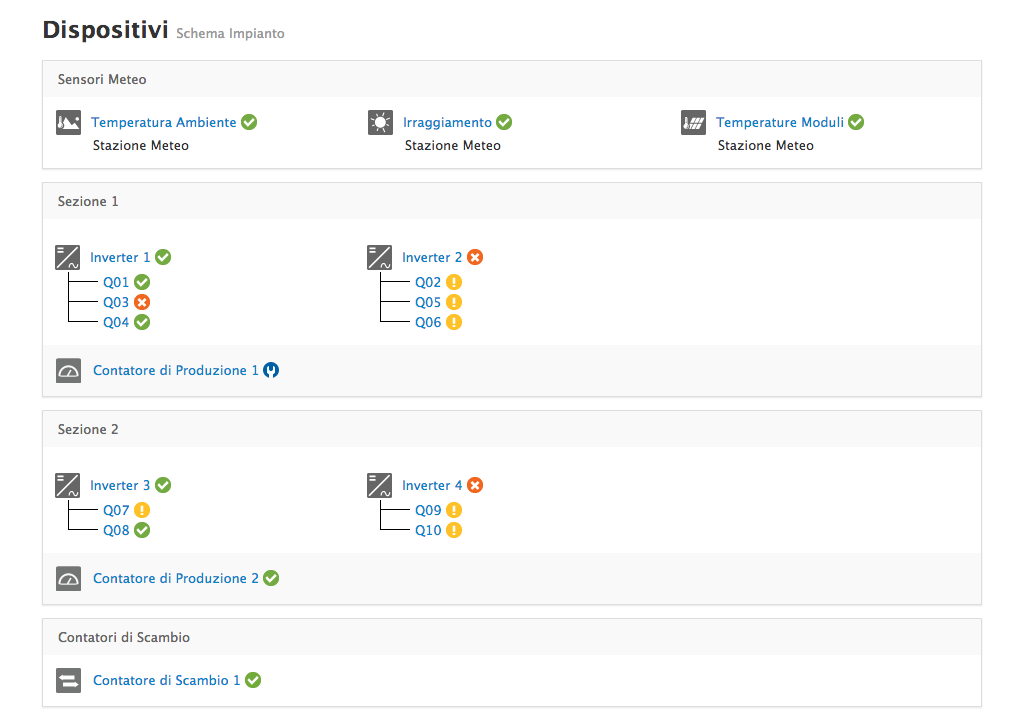
System diagram
You can always view the performance status of each system component in real time.
Various status levels visually communicate the trend which can be of the following type: regular, attention, alarm, blocker and in maintenance.
By clicking on each device you enter an in-depth section where you can see its details and view its history.
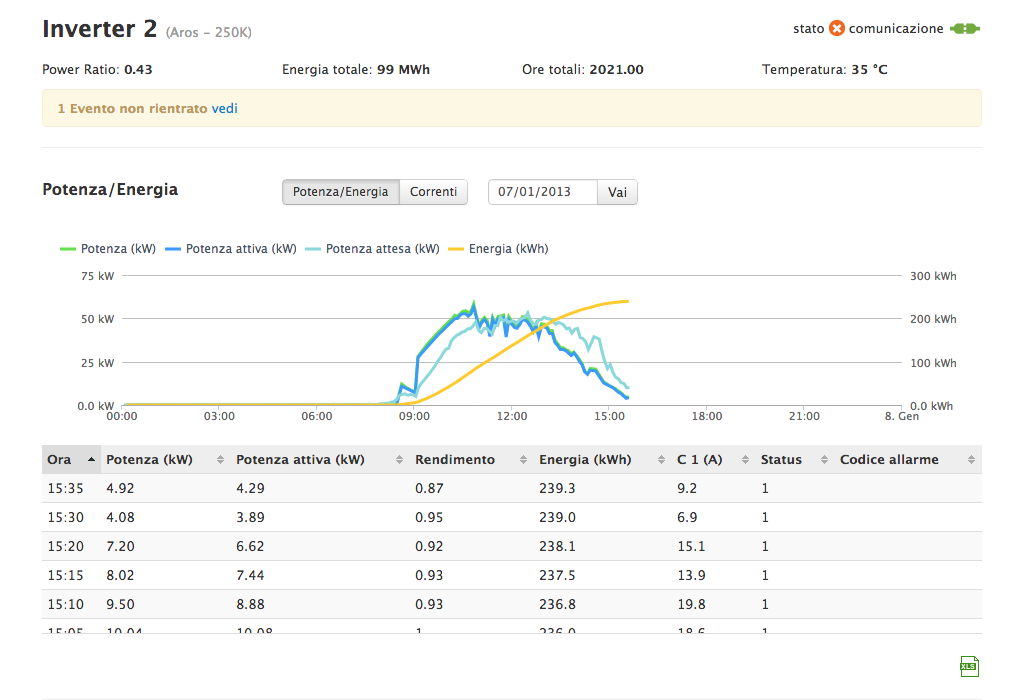
Device data detail
For each device in the field, whether it is an inverter, a string panel, a production counter or a weather station, a detailed screen is always available where the data received up to that moment is displayed. The graph shows the trend of the day while the table below shows the analytical data.
You can also export the displayed data in Excel format and choose to view a different day by selecting it from the calendar.
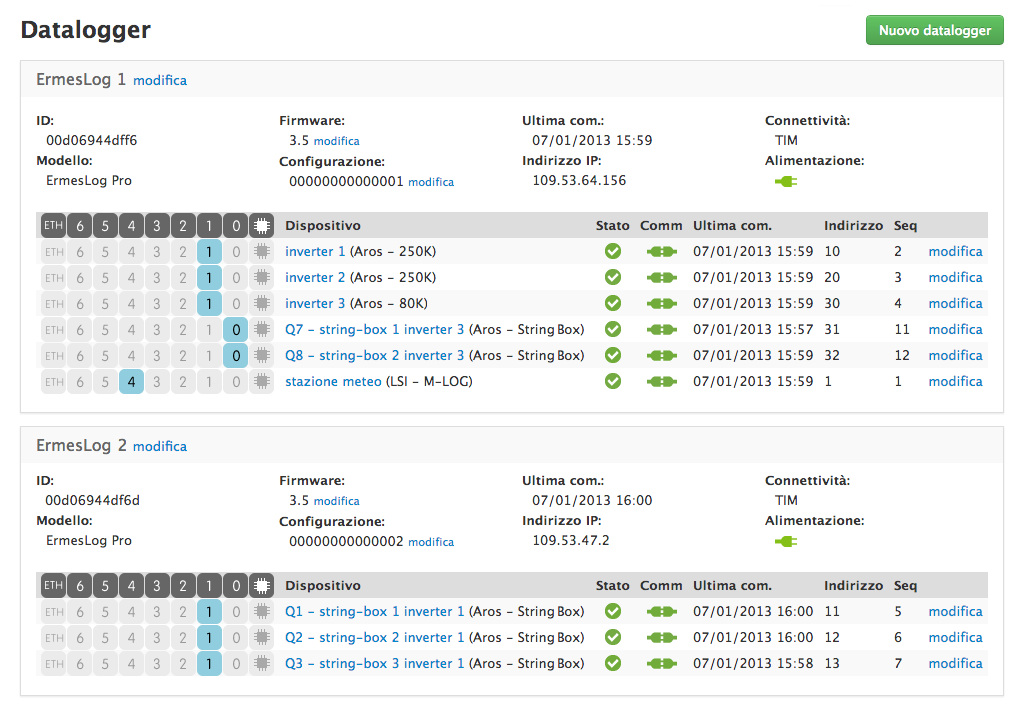
Connections and communications diagram
In a single page, you can view the communication status of each data logger present on the system and its physical connection with the devices in the field. (port and connection parameters, addresses, etc).
Just as easily, you can access the remote configuration and firmware update menu.
O&M Management
Integrated Ticket System
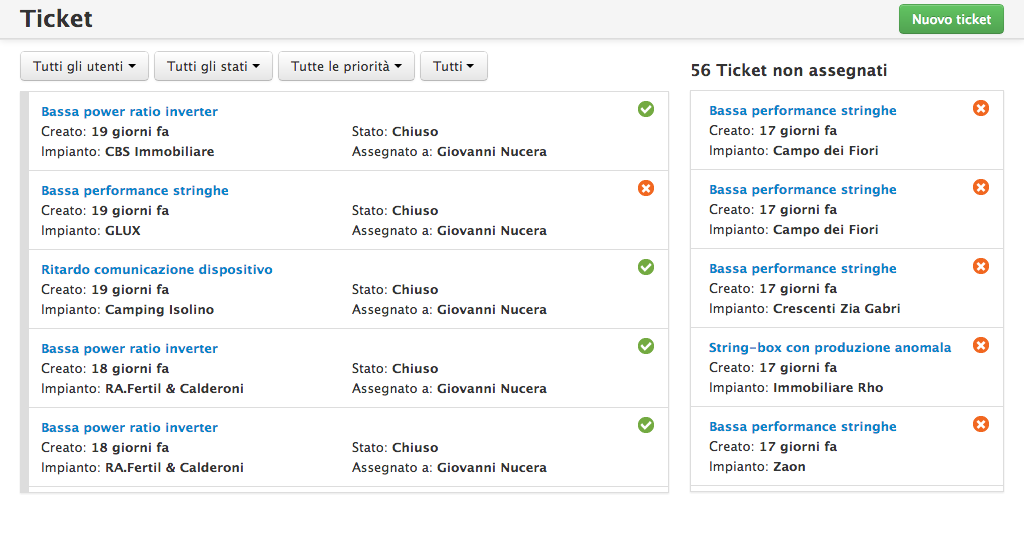
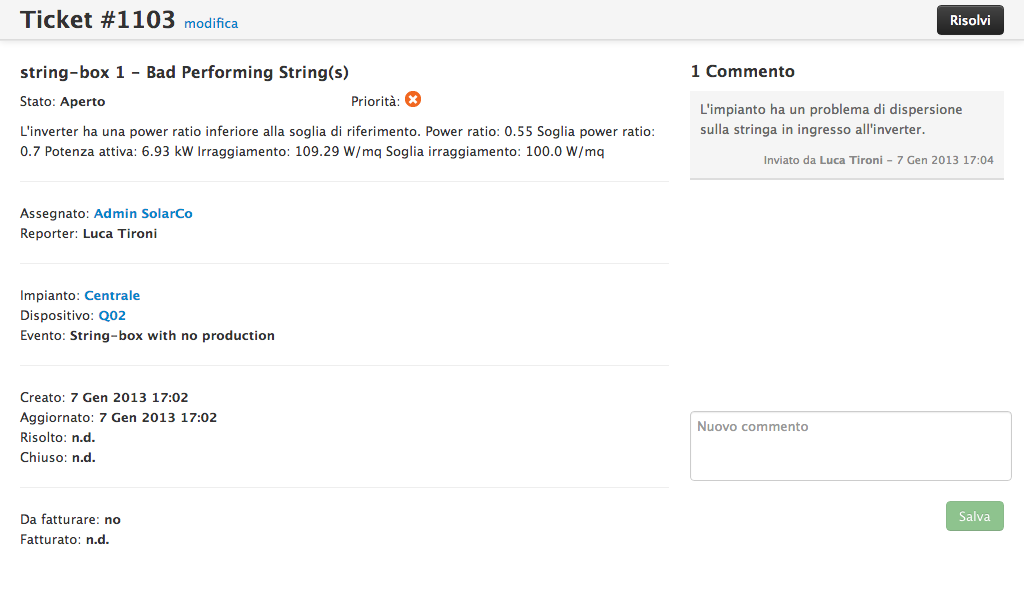
The platform offers a powerful tool for tracking the activities to be carried out on the plants.
Each user can be assigned activities to be carried out on a specific system / device.
Tickets can be opened manually by a manager or by the technicians themselves.
They can also be ordered at will, thus creating a ToDo List for each maintenance technician in a personalized order of priority.
For the most critical events, the platform itself opens autonomously tickets which must then be sorted to whoever is responsible.
Each technician always has the activities to be carried out under control and in the same way the management is guaranteed to always have a complete and orderly overview of all the activities of the installed park.
Each technician always has the activities to be carried out under control and in the same way the management is guaranteed to always have a complete and orderly overview of all the activities of the installed park.
By its nature, the ticket system is the best place to centralize and share intervention reports with annotations, documents and photographs.
Events and notifications
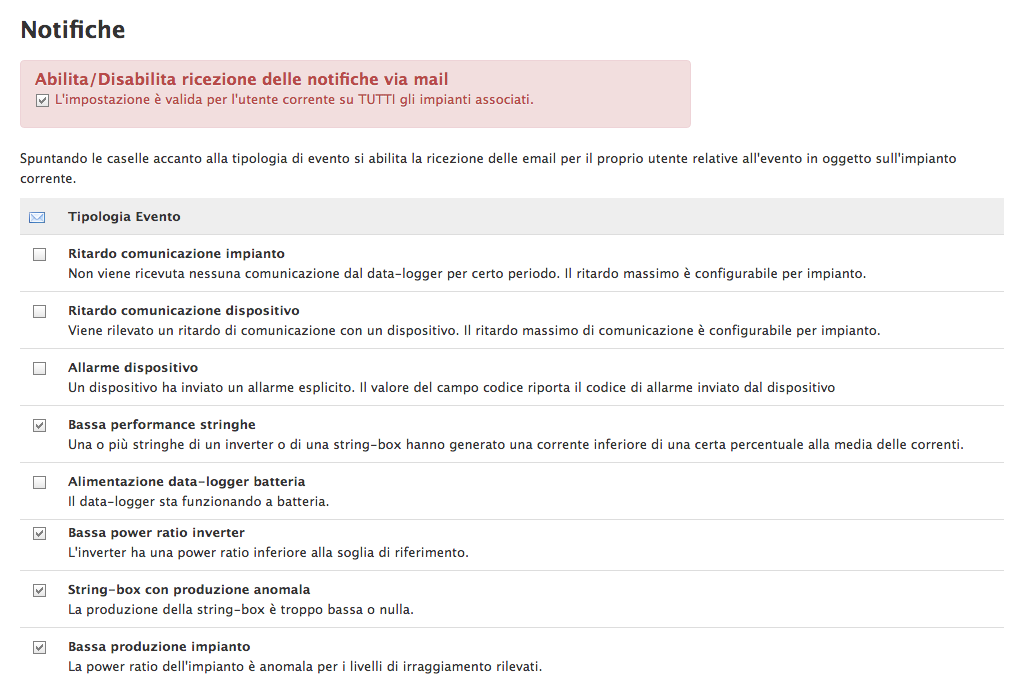
The web platform sends emails and text messages to notify more or less serious situations.
It is possible to customize the type of alarm you want to receive for each system.
The event management system has matured over the years by integrating escalation logic to avoid false positives and the receipt of an excessive number of notifications.
Event log
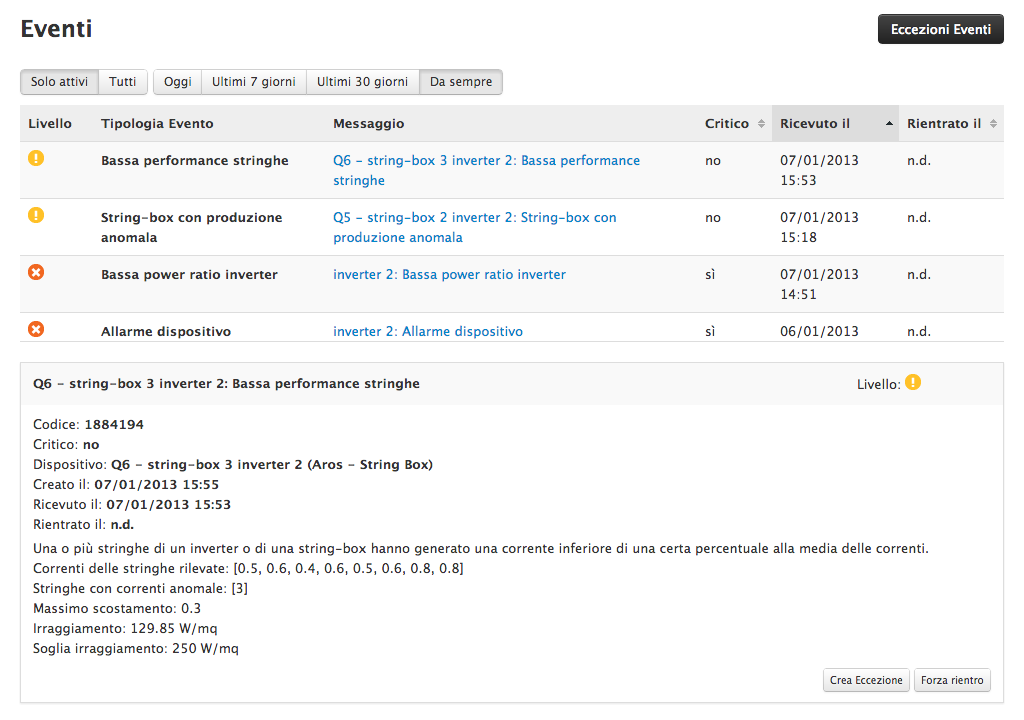
Each event, regardless of its severity, is archived in the system.
The event log allows you to view all the events that are still open on the system at any time and also allows you to view the history of those closed.
Analysis and Report
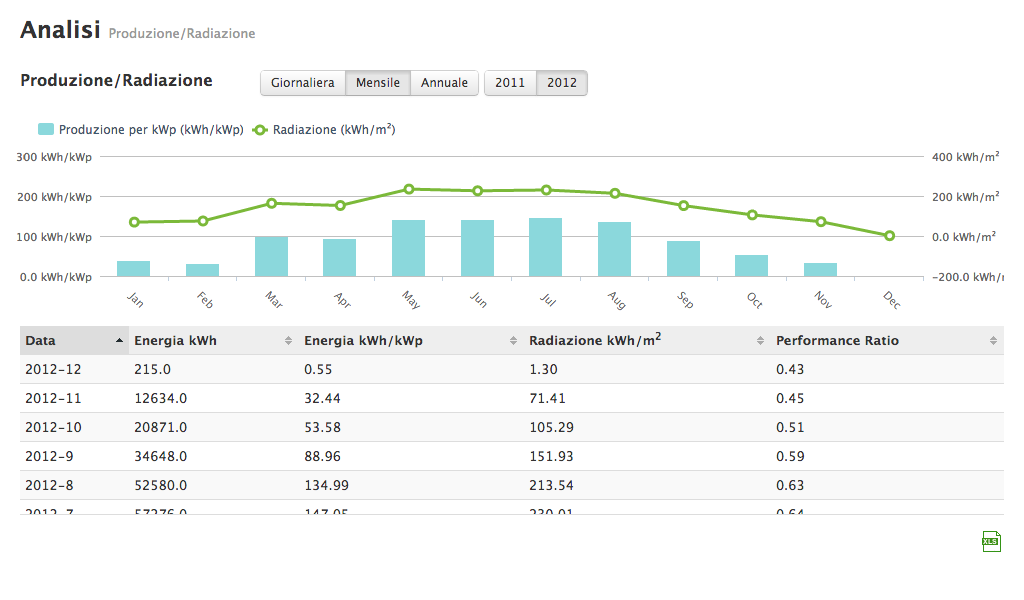
At any time, from the analysis section or monthly thanks to the automatically generated pdf report, all the daily data are always available, highlighting the trends and reporting all the details and any alarm situations.
Similarly, in the selected period, the interventions performed by the O&M are also summarized.
Cloud
Cloud-based infrastructure.
The whole platform is developed with the latest generation of web technologies. There are no PCs or servers to be installed on the system or elsewhere. You don’t have to worry about data backup or other maintenance.
Database
Your system data is yours.
Every month we export all the data read in the field for each device and make them available for download.
In real time, you can also download the entire day data of each device that is being monitored in Excel format.
Web & Mobile
The whole platform is developed in HTML 5 without using flash or other proprietary technologies.
Native compatibility with latest generation smartphones and tablets.

